As a safety manager, being across your organization’s safety and compliance status is paramount.
Not only do you need to be aware of how your workplace is tracking and ways it can improve, but
you also need to report on those results to your executive team.
If you’re like many (pre-Donesafe!) businesses, you’re likely handling reports in one of two ways:
- Manually generating reports by inputting data from paper forms into spreadsheets
- Running several reports across multiple systems that handle different elements of your businesses’ safety and trying to consolidate the results.
Both options are pretty darn time consuming, not to mention capable of making you feel you’re
missing a beat on your safety pulse day to day.
Now imagine you could get back hours every week, by not having to manually create or run reports
across various clunky systems. Just set them up once and have them update in real-time.
With Donesafe, you can. Our reports are pre-built into the system, so you’ll always be up to date on
safety across your organization. No more spreadsheets, no more wishing you had more time to get
everything done.
Aus Flight Handling – one of Donesafe’s clients – used to spend 2 days manually extracting data from multiple systems for their weekly safety reporting. Yet after moving to Donesafe, they now access their reporting and data instantly, saving hours every week on repetitive work. (Check out the case study here)
Interested? Read on to find out how reports can supercharge your safety management.
How do reports work?
Every Donesafe account has the reports functionality enabled. You can configure any number of
reports based on the data that matters most to your business. Once set up, they’ll always populate
with relevant data; no need to spend valuable time building out reports each month.
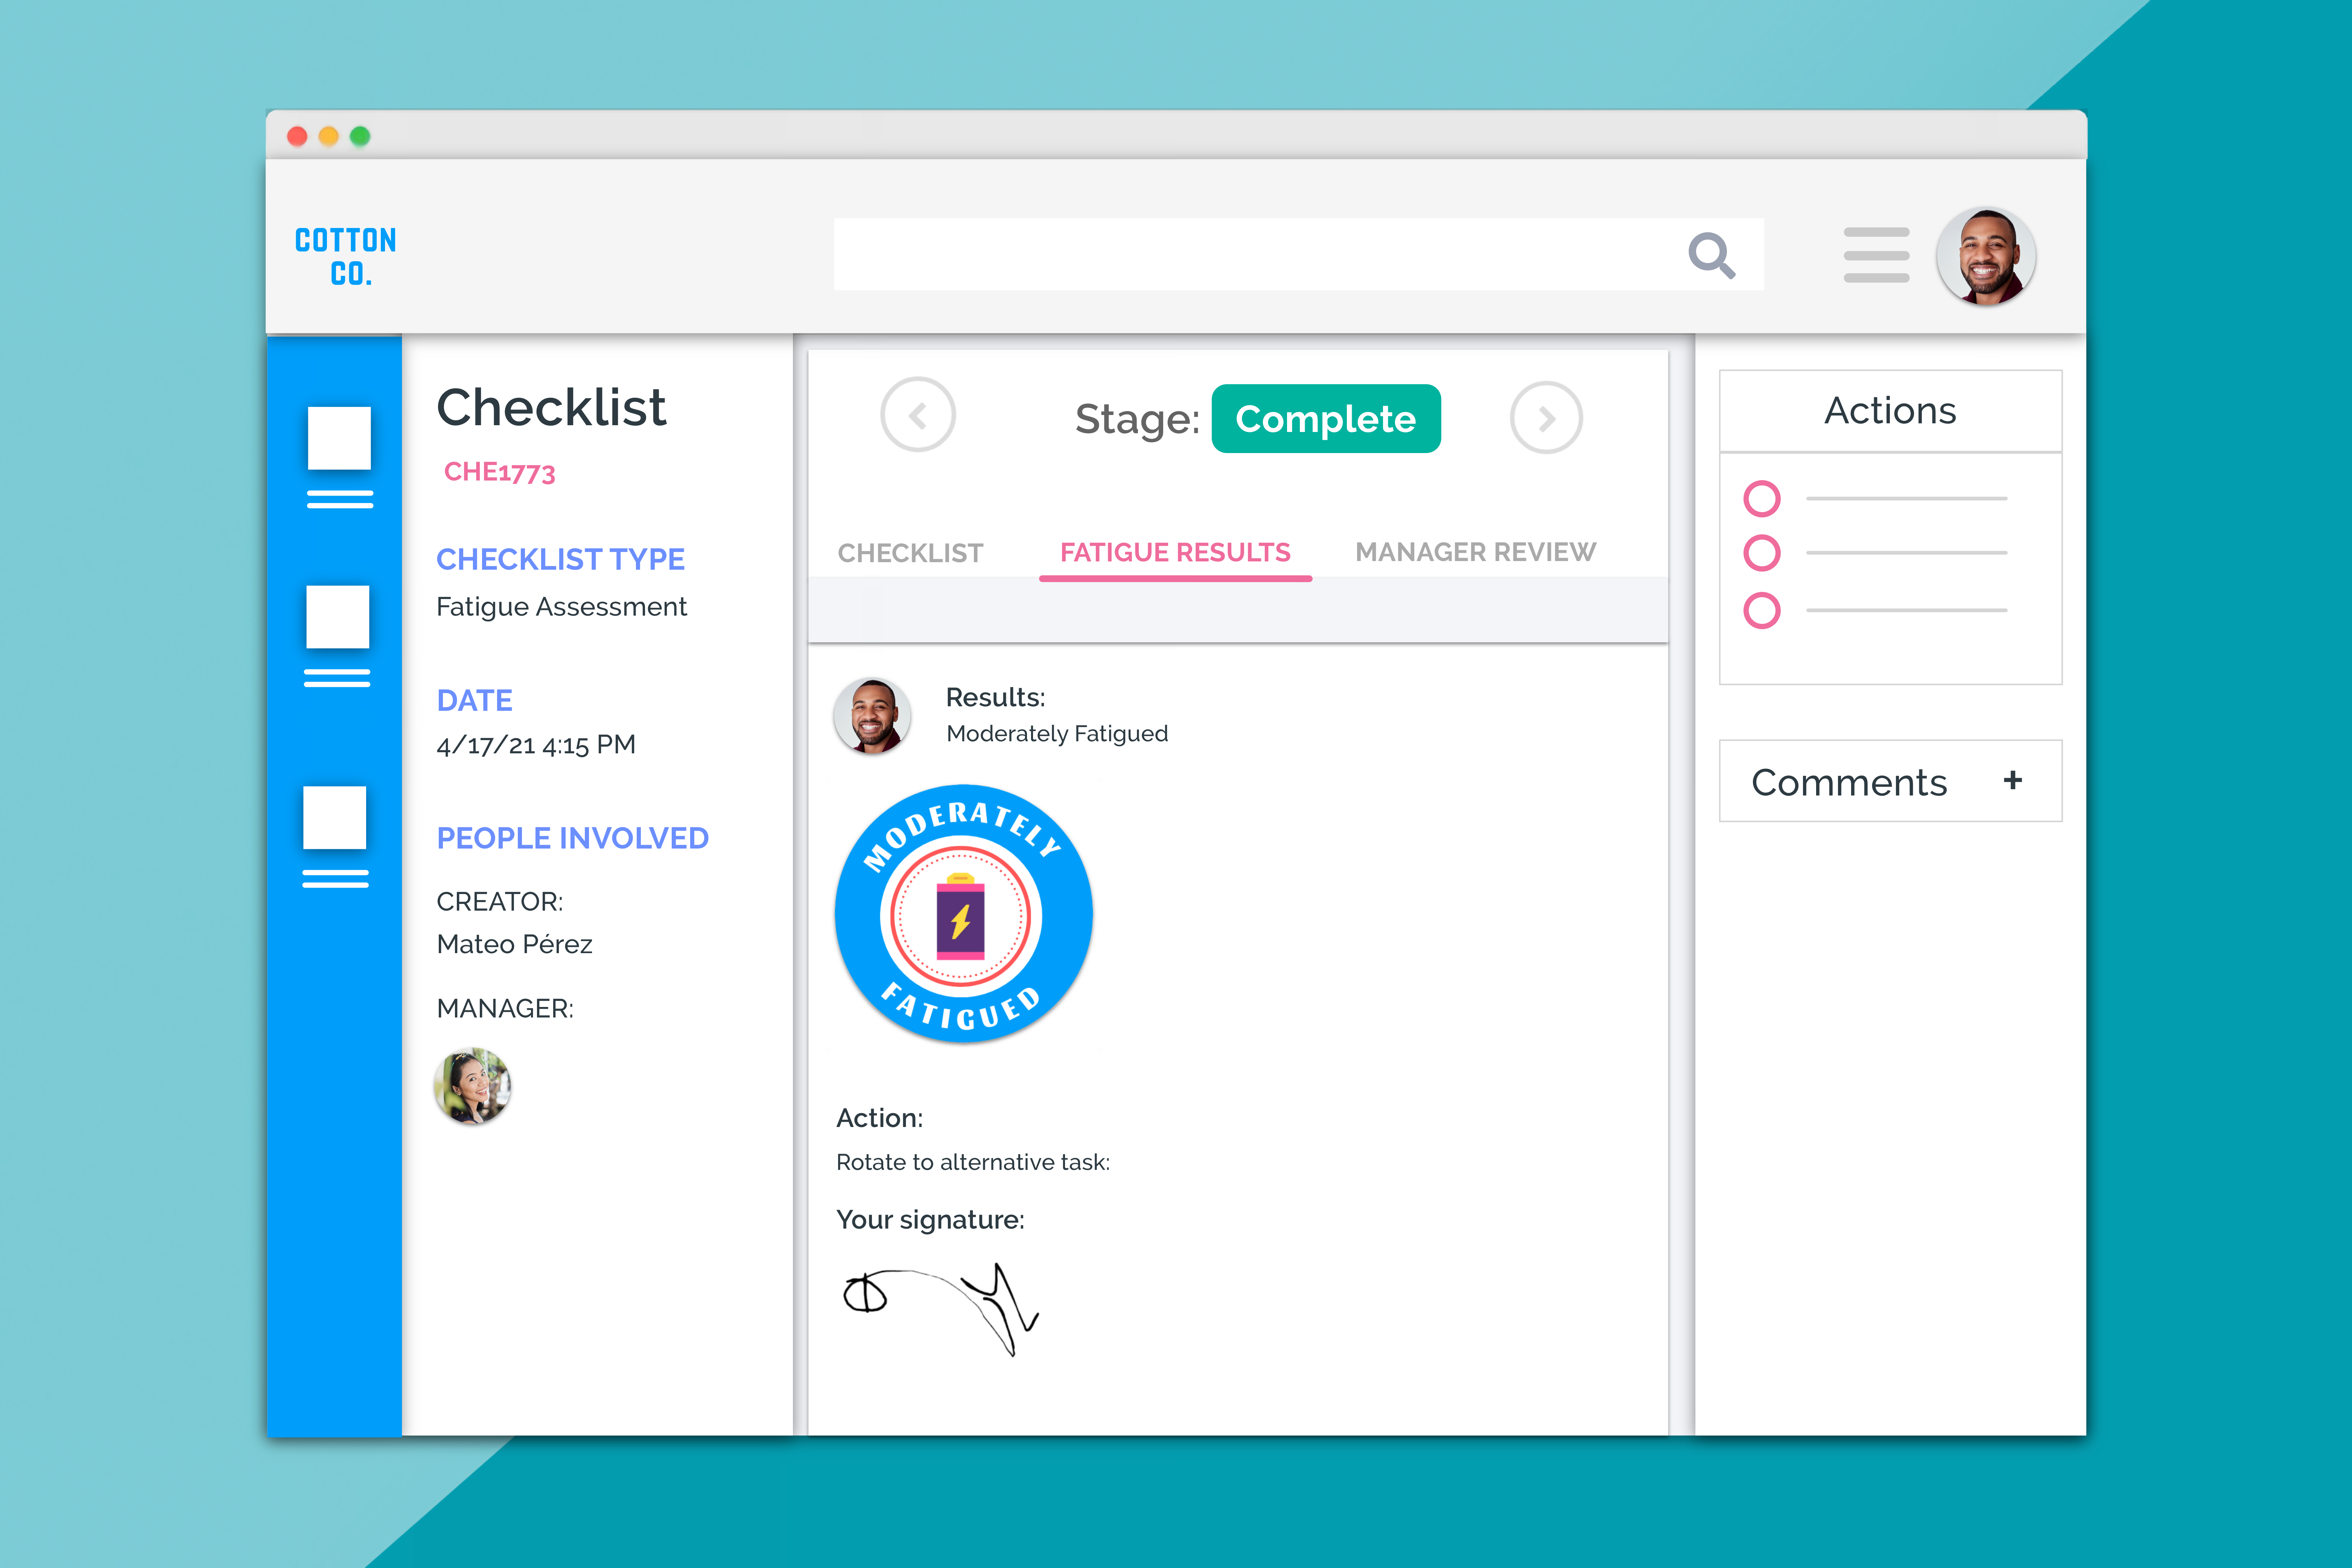
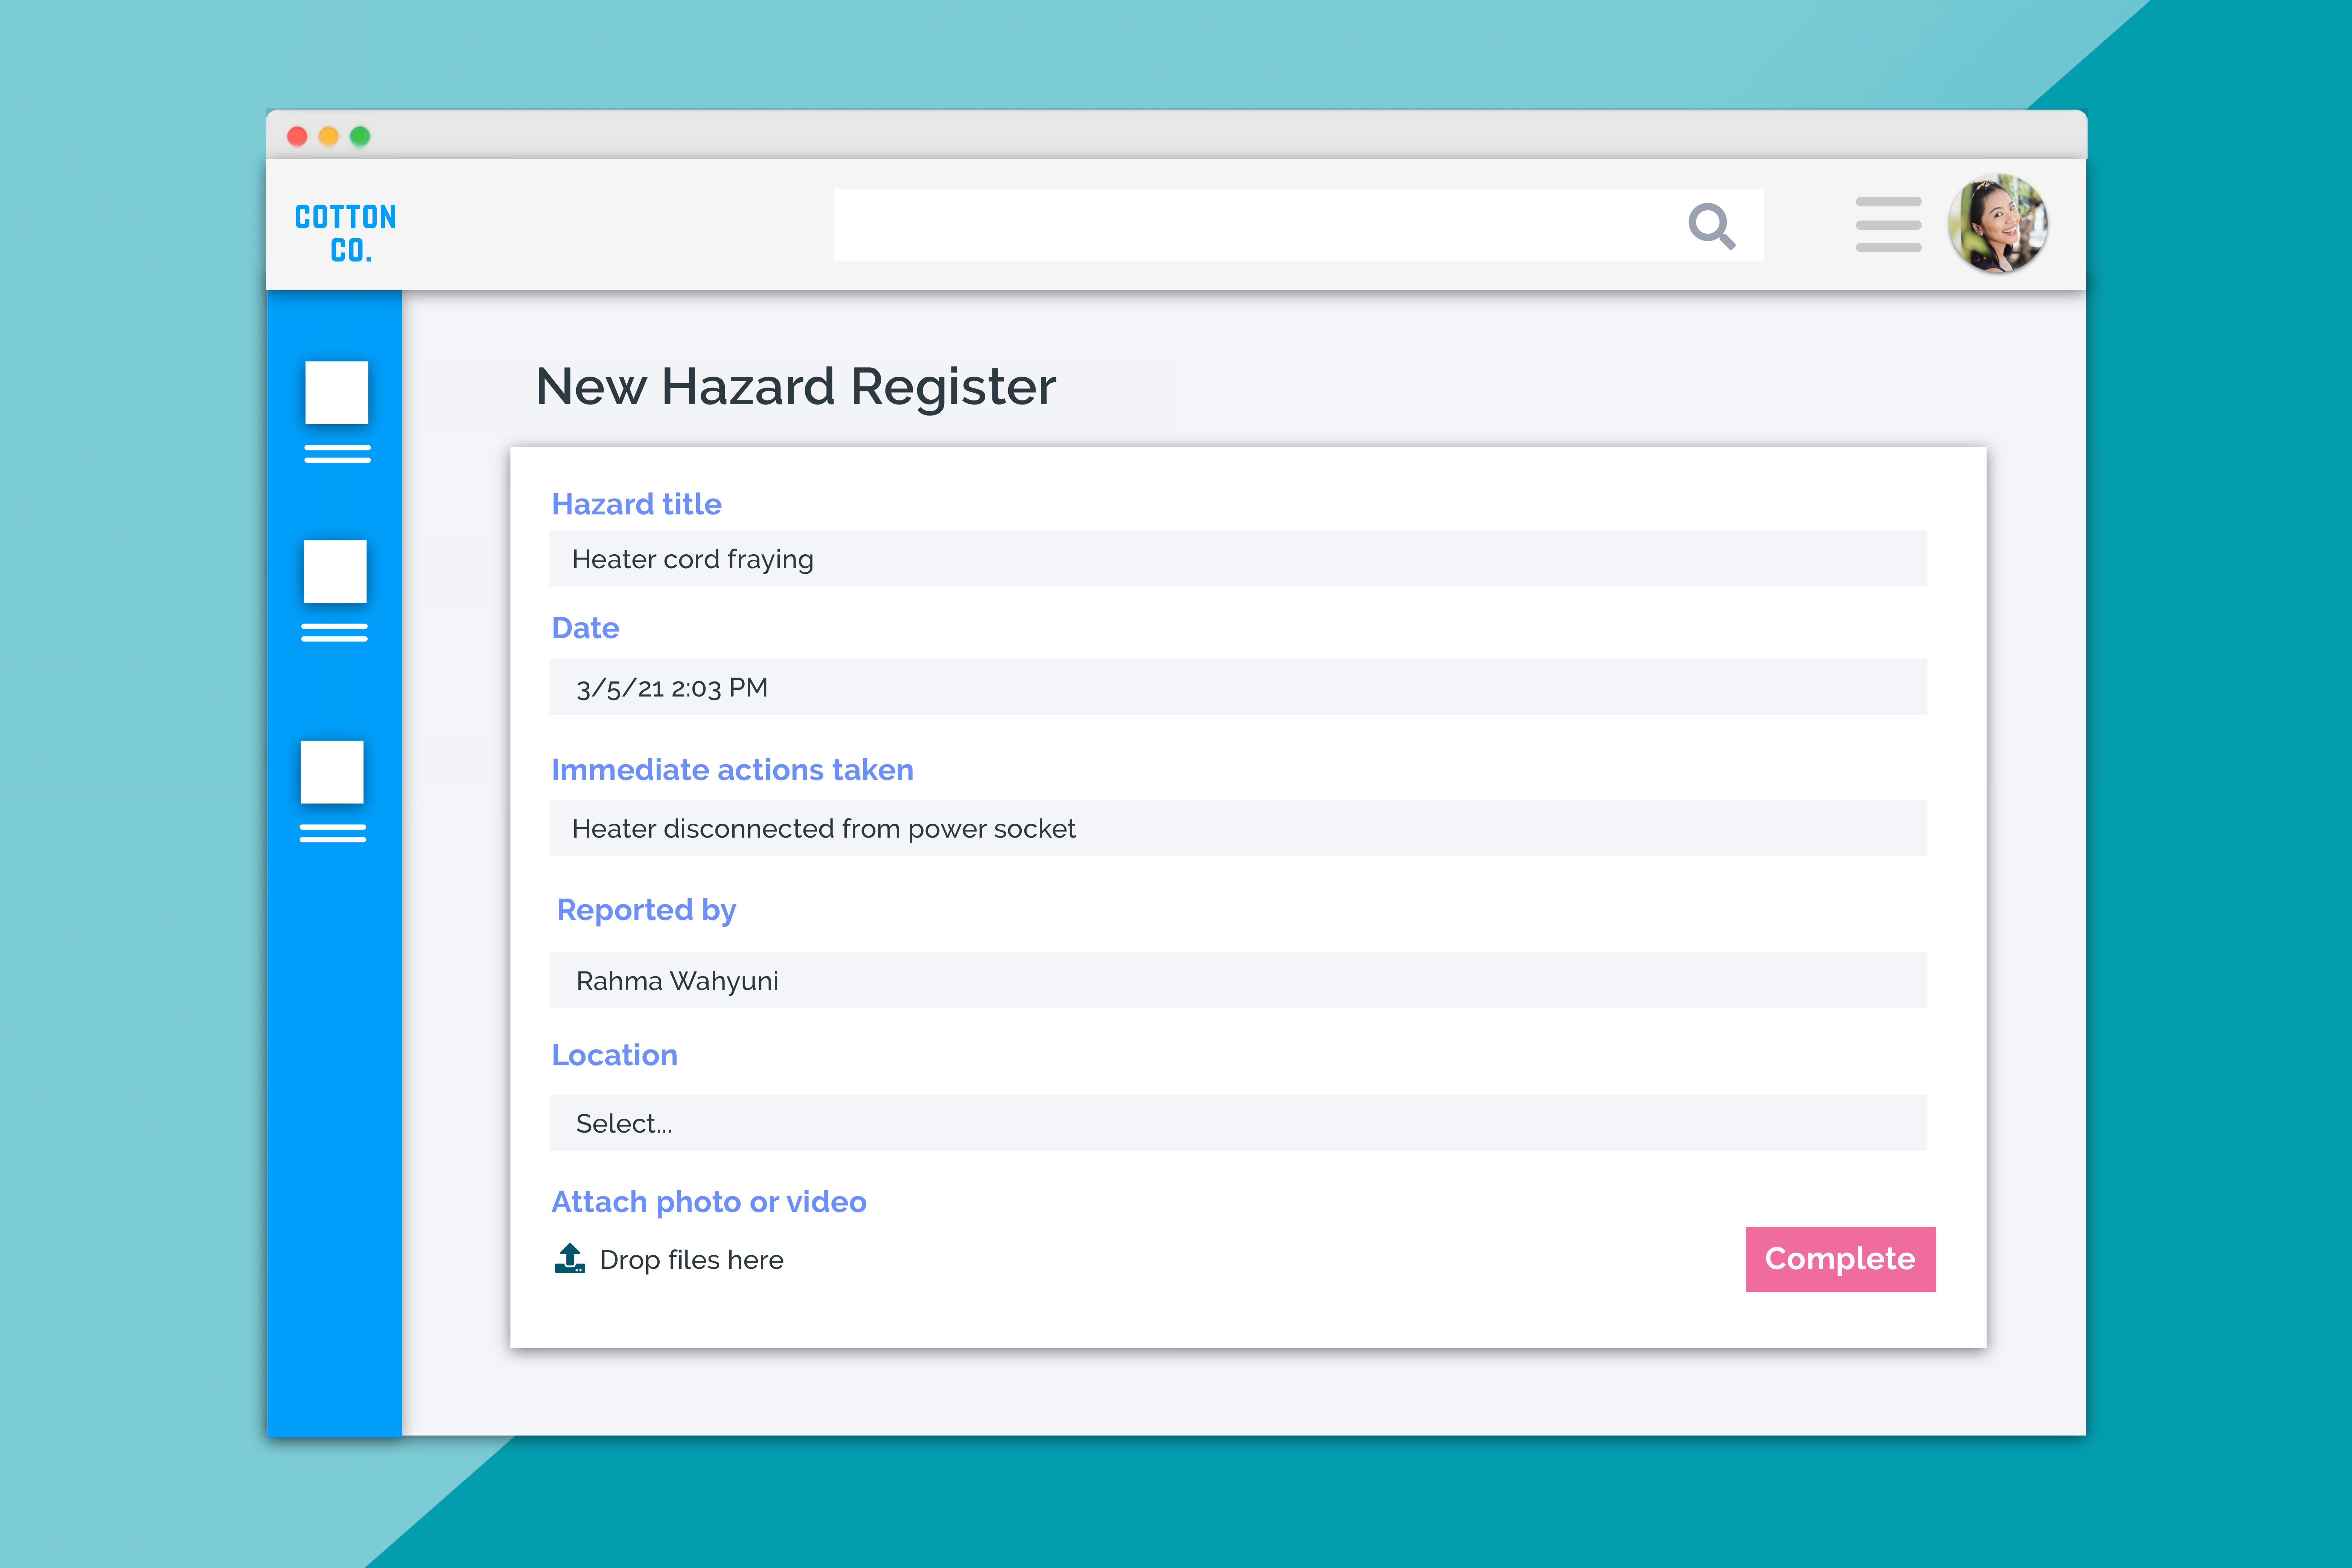
Reports can be set up for every app – incidents, hazards, audits, contractor management, checklists,
and so on – and can focus on both the higher-level information (such as number of incidents per
month per location), to the more granular (such as incidents by treatment type by location).
You can access your reports for all apps from the one location in Donesafe. You can also connect all
your apps, people and data in the one place by combining reports from different apps.
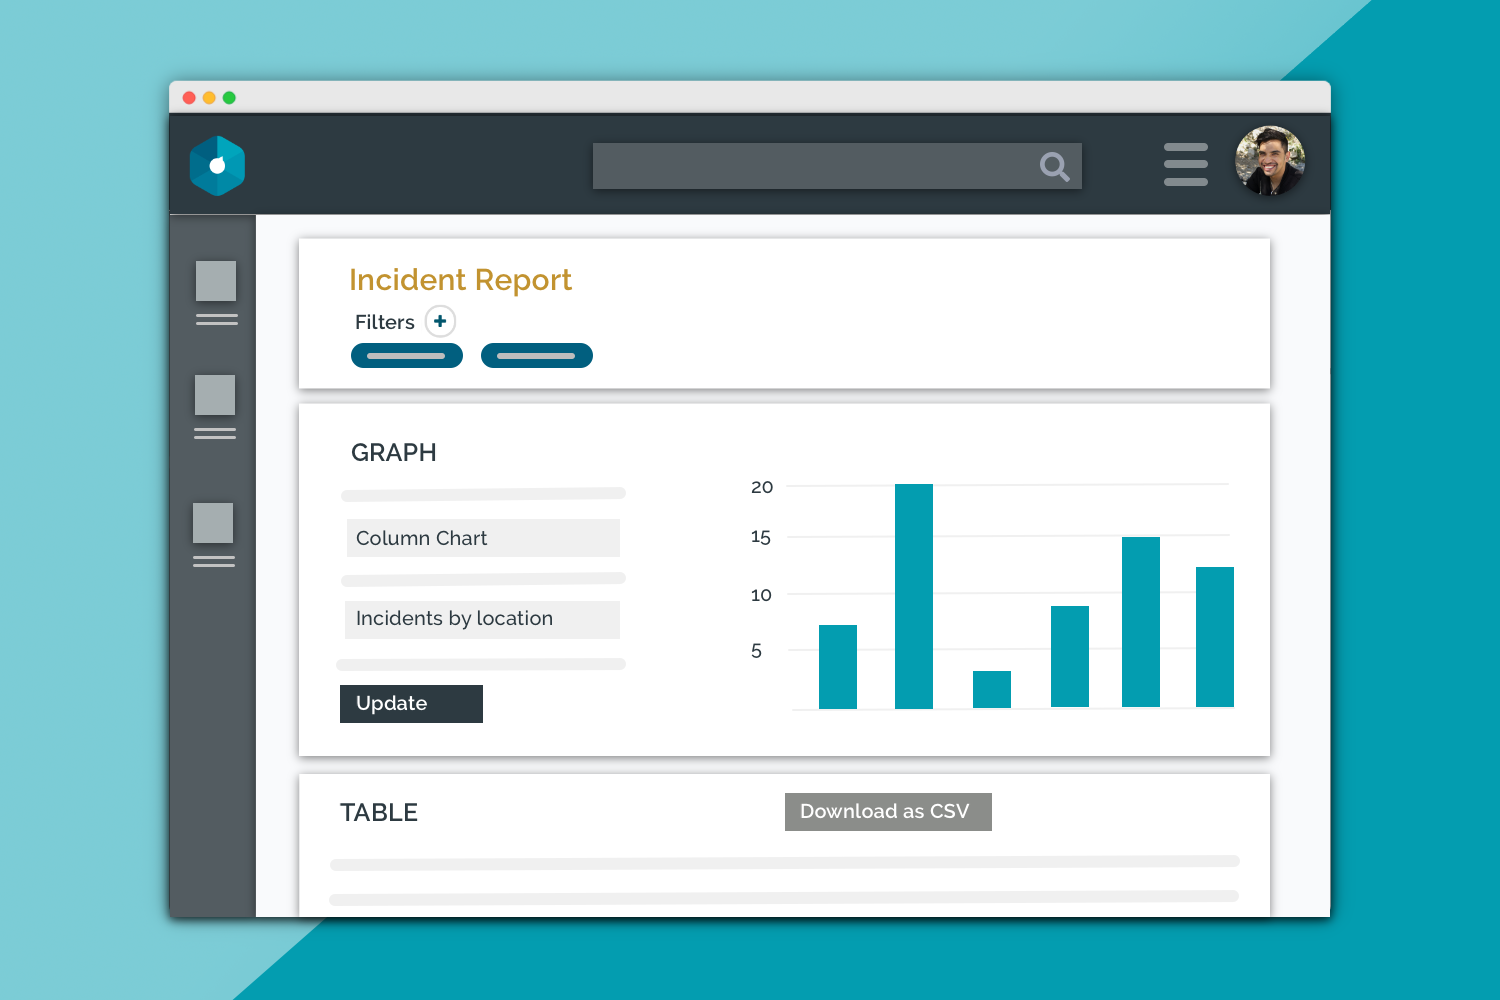
You can use filters, group the data in various ways, and choose how it’s displayed via a line, column,
bar or pie chart. You can also easily export the data via CSV to run further analyses in Excel.
What’s more, you can configure your Donesafe dashboard to display the surface information of any
report you set up, which can then be drilled into via a click. This means you’ll have key reporting
data readily available and visible, with the capacity to drill into the data for more specific detail.
Check out the video below for a quick preview!
Some cool features of reports
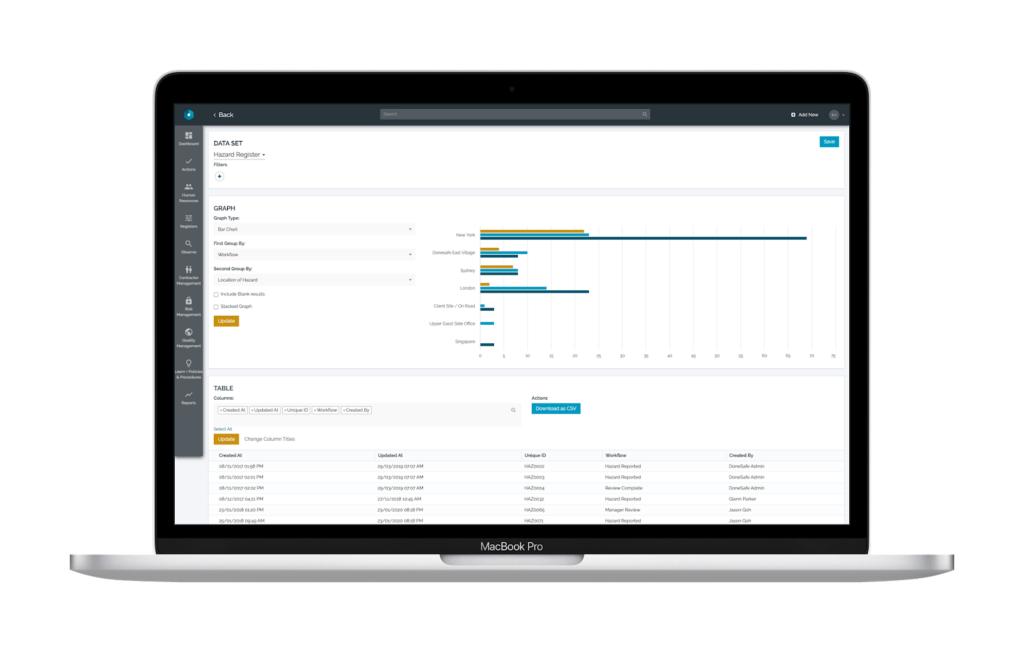
- Set up filters: Need to display data based on specific parameters? Use filters to filter the data based on your set requirements.
- Choose your graph type: Choose the best way to visualize the data; choose between line, bar, column and pie graphs.
- Group the data: For further insights, you can group data based on 1-2 variables.
- Select who has permission to view: For each report, you can nominate which roles have permission to see the report. You might have manager-only reports, along with reports only visible to the executive team, based on the data that’s relevant to them.
- Configure table data: For your tabulated data, you can configure what data is displayed in columns, the ordering of that information, as well as updating them with descriptive titles.
- Download to CSV: You can download any report as a CSV for further analysis.
To learn more about Donesafe’s reports, book a demo with our team:
Book a Demo
Share: